
Is the INK Canadian Insider Index set to go parabolic?
Thank you for joining us in a weekly technical look at the mid-cap oriented INK Canadian Insider (CIN) Index. Last week, the Index enjoyed another rally, as it briefly crossed the 1100 level and rose 13 points or 1.12% to close at 1097.15 after setting a year-to-date high of 1105.94 on Wednesday.
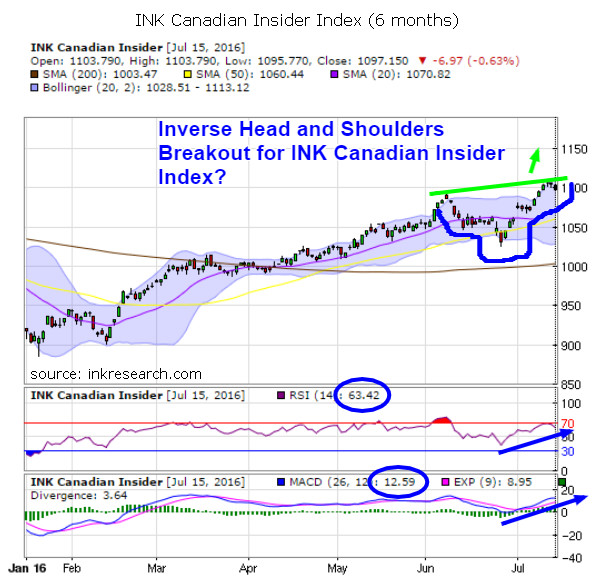
Momentum indicators remained in acceleration mode as RSI ticked up 1 point to 63.42 and MACD rocketed a fiery 103% to 12.59.
Overhead resistance is at 1101 and, beyond that, at 1111. Minor support is at 1090, and major support is at 1079.
As you can see by the blue outline on my chart, the Index has carved out a bullish, upside-down (or inverse) head and shoulders pattern. Should the Index burst another 1% through the 1111 level (the Index's 2015 high) with sufficient force, there is very little resistance above, and, as a result, we could see a rally to 1150 (a further 4% move) in short order.
Many investors and fund managers who white-knuckled it through the steep corrections of early January remain skeptical of the markets overall, and this murky outlook is seemingly compounded by the uncertainty surrounding Europe after the surprising Brexit vote, a tight race in the upcoming US election, and numerous unsettling international conflicts and terrorist attacks.
Based on my own forecasts and analysis, the INK Canadian Insider Index, along with commodities like gold and silver, as well as the S&P 500 SPDR ETF (SPY*US) and emerging markets are in the early stages of a parabolic rise. If investors can tune out the noise - that is, the relentless stream of negative world news and a financial media that is notoriously poor at predicting the future - they may stand to profit handsomely by following these powerful yet nascent uptrends.
Category:
- Please sign in or create an account to leave comments
Please make the indicated changes including the new text: US quotes snapshot data provided by IEX. Additional price data and company information powered by Twelve Data.