
INK Canadian Insider Index hits new highs
Thank you for joining us in a weekly technical look at the mid-cap oriented INK Canadian Insider (CIN) Index. Last week, the Index followed our analysis when it completed a two-week long bullish consolidation at the 1100 level before it finally bulled ahead and notched a brand new 2016 closing high of 1117.78 a gain of 17.5 points or 1.5%.
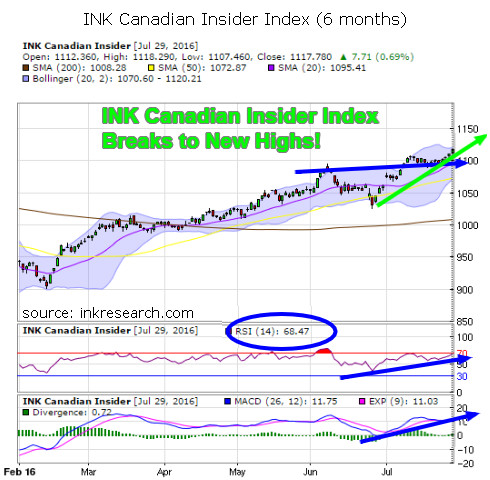
In fact, the Index closed the week strongly on Friday, closing a hair from its week's highs and with a nice tall white candle on its chart. 'Candle' might be an appropriate term as the Index, along with gold, silver and other indices and sectors I follow are beginning to melt- up, that is. The Index's chart, which has now rocketed 26% above its January lows, is beginning to curve upwards rather bullishly, suggesting a lot of blue sky upside ahead for investors. In fact, the chart may be in the process of completing a classic bullish cup and handle breakout pattern (which we might look at next week using a multi-year chart), especially as the Index has now vaulted above its 2015 high of 1111.18.
Our short-term indicator RSI rose significantly, surging 7 points or 11% to 68.47. MACD increased modestly by 0.4 points to 11.75.
Resistance is at 1120 and 1130 while support lies at 1100 and 1071. And I will just add that the 1150 level looks like a potential upside target over the next few weeks.
Category:
- Please sign in or create an account to leave comments
Please make the indicated changes including the new text: US quotes snapshot data provided by IEX. Additional price data and company information powered by Twelve Data.